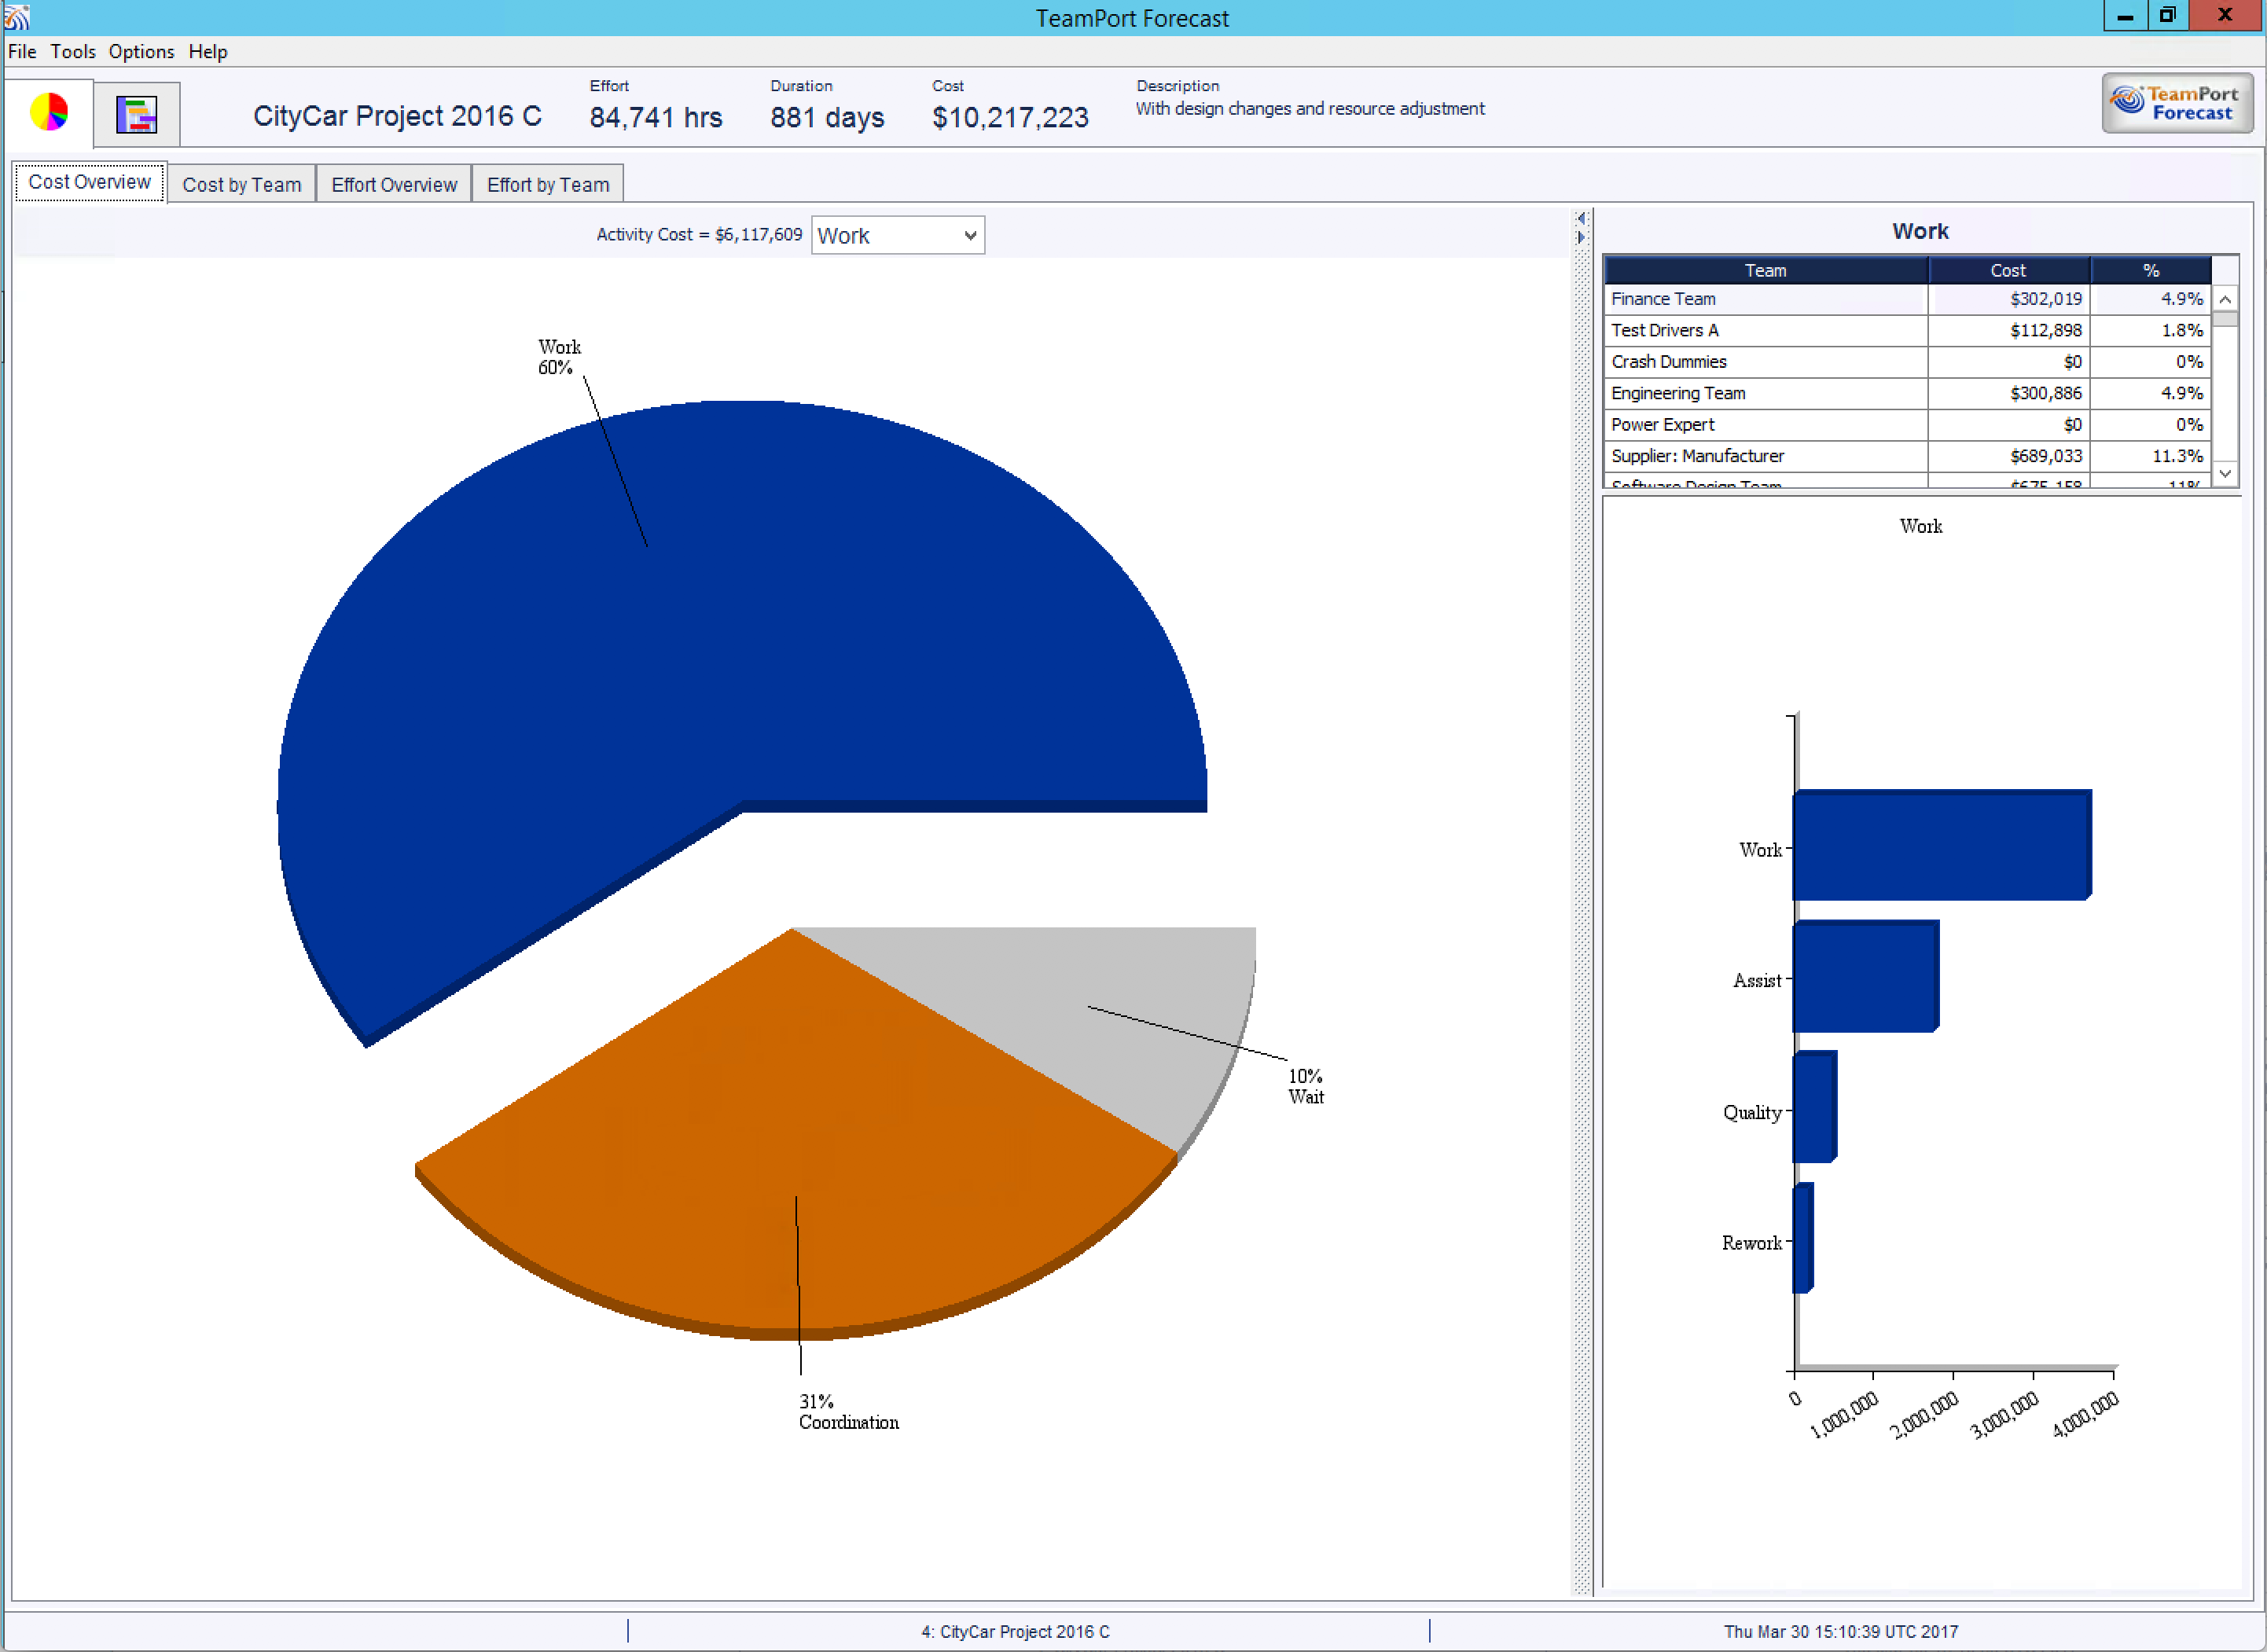
The overview chart views allow you to see at a high level how effort and cost are distributed in the project. Over multiple simulations these views will give you a rapid feel for the project, which can help you to rapidly asses if design actions taken are moving the project design towards a desired direction. You can dig into details that will inform further design decisions without having to analyze lots of data to understand the overall performance of the project's design. These views are designed to support top-down analysis and thinking.
The bold view of the pie charts can rapidly indicate a problem with the project model and then support you as you dig in to better understand what actions should be taken. Gaining a familiarity with the pie charts will help you to quickly see aberrations in the project's design as it progresses. A typical example: as a project is developed and your team adds dependencies, a simulation shows a substantial jump in wait time, meaning teams are available but unable to complete activities due to being blocked by dependency relationships. Wait time details will show which teams are waiting and guide your research and actions to alleviate the issue.
You will likely spend more time analyzing the Gantt views and the details shown there. However, you should not discount the value that these views hold for you while modeling your project.
The Charts view represents a project forecast at several levels of detail:
The area to the right of the tab controls shows the project name and forecast results in effort, duration, and cost as well as a description as inputted at the time of simulation. The bottom of the forecast window also shows the project name and the date of the simulation.
The main pane shows an overview of the project broken down by appropriate categories, either cost/effort type or team. The specific sections of the pie chart can be selected by clicking on them or by using the dropdown menu just above the pie chart. In some cases the pie slices will be too small to select with the mouse.
The detail pane, when displayed, will show a further breakdown of the selected section both in tabular and graphical forms.
No tool bar is used in the chart views.

In the Chart views the project forecast can be viewed from four perspectives:
The only controls for this view are the four tabs to select the perspective, the ability to select a section of the pie chart by direct selection or through the dropdown menu above, and the ability to resize the detail panel horizontally and vertically.